Course Overview
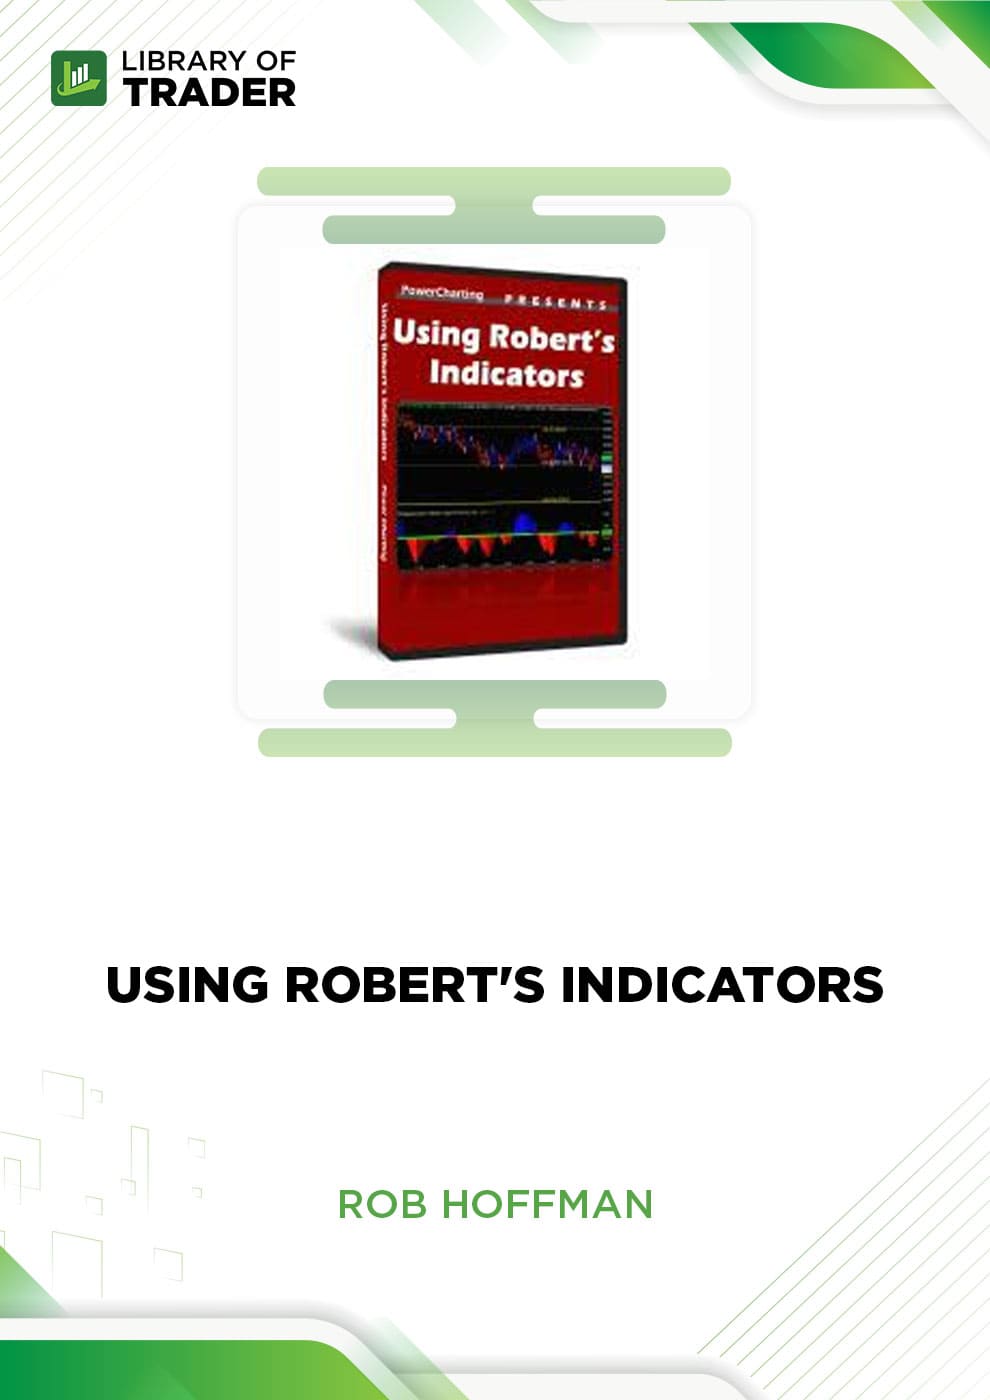
This 3 hour course systematically looks at Roberts trading setup including all of his charts, actual indicators, the settings for each of the indicators, and thorough discussion of how he creates his well respected and critical support and resistance levels.
Course Outline
120 minute chart, Bollinger Band constriction and non conventional
15 minute charts and multiple time frame charts
20 MA, Bollinger bands, ADX, MACD, RSI and Macro trend
ADX – indicates strength of move not direction of trend
Calculating support and resistance levels
Daily chart, RSI
Divergence trading and MACD Non conventional approach
E mini, ES daily chart and DOW and Nasdaq daily chart
Edwards and McGee
Electronic trading, overnight trading and volume
eSignal Pro version
eSignal, VIX, VWAP setup and standard indicators
Fibonacci numbers
Floor pivots, DWM pivots and Fibonacci number
Higher time frame has more validity
Indicator listing with setups
And so much more!
What Will You Learn?
Roberts trading setup including all of his charts, actual indicators, the settings for each of the indicators, and thorough discussion of how he creates his well respected and critical support and resistance levels.
Who Is This Course For?
Traders who need to improve their chart reading skills.
Traders who need to improve their trading skills in different time frames.
 Using Money Management to Improve Your Trading Performance – David Stendahl
$34.00
 Vadym Graifer’s Scalper Video Course – Reality Trader
$34.00
Using Robert’s Indicators – Rob Hoffman
$34.00


