Course overview
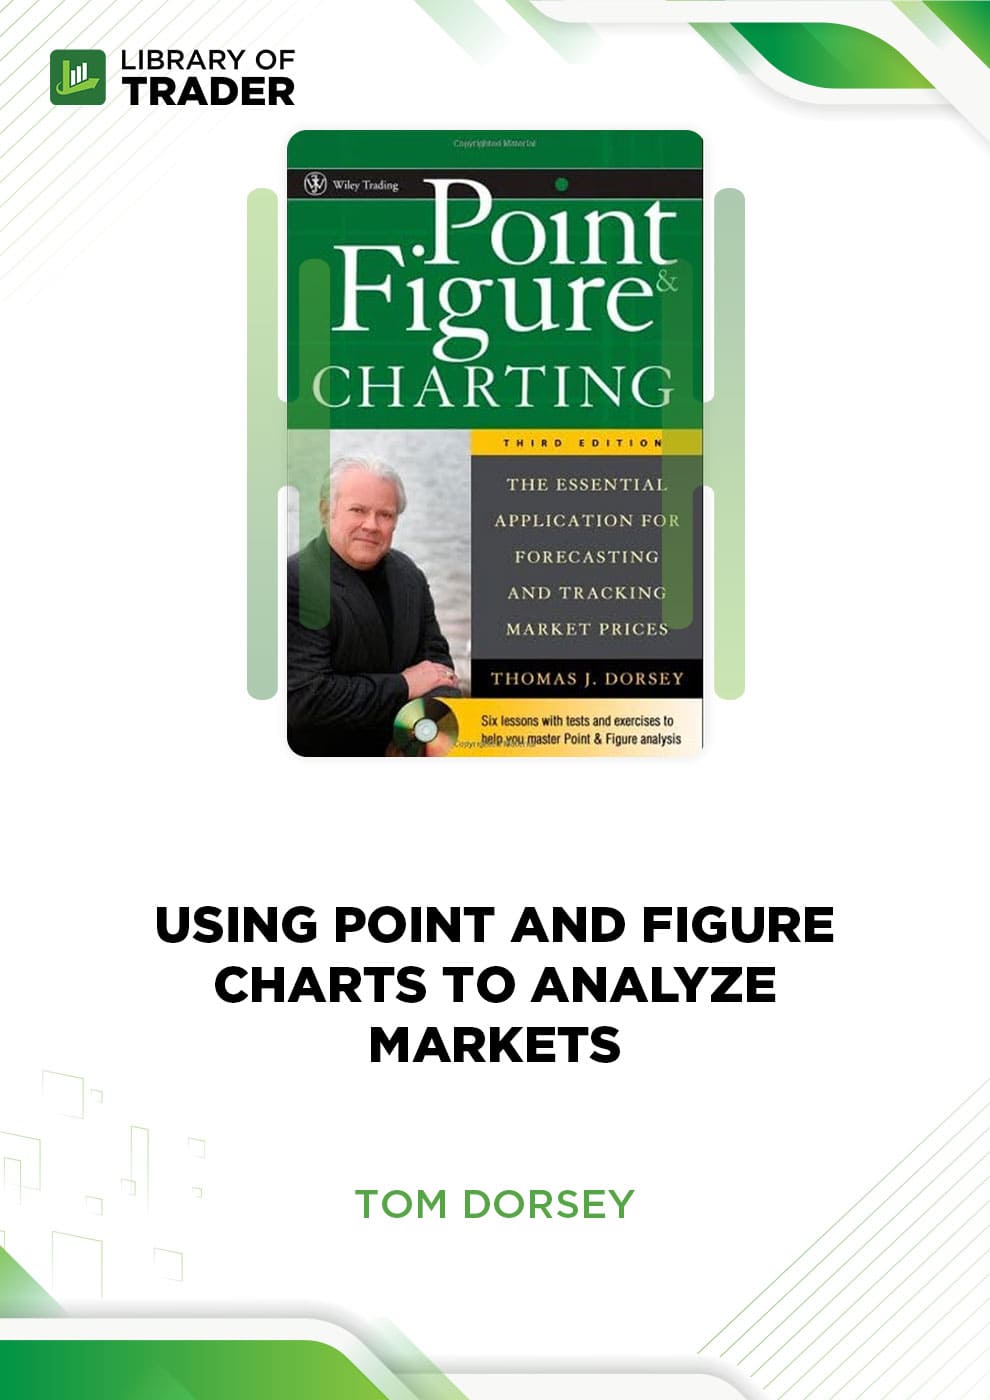
Using Point and Figure Charts to Analyze Markets – Tom Dorsey reveals an investment approach that has stood the test of time, during both bull and bear markets, and is easy enough to learn, whether you’re an expert or aspiring investor. Filled with in-depth insights and expert advice, this practical guide will help you grow your assets in any market.
This course is designed for Technical Analysis.
Course Outline
Video Clip: Tom Dorsey Using Point and Figure Charts to Analyze Markets
What will you learn?
Step-by-step, how to create, maintain, and interpret your own point and figure charts with regard to markets, sectors, and individual securities.
How to use other indicators, including moving averages, advance-decline lines, and relative strength to augment point and figure analysis.
How to use this approach to track and forecast market prices and develop an overall investment strategy.
How to use point and figure analysis to evaluate the strength of international markets and rotate exposure from country to country.
Who is this course for?
This course is ideal for those who want to master their skills of point and figure charting to grow their assets in any market.


