
Course overview
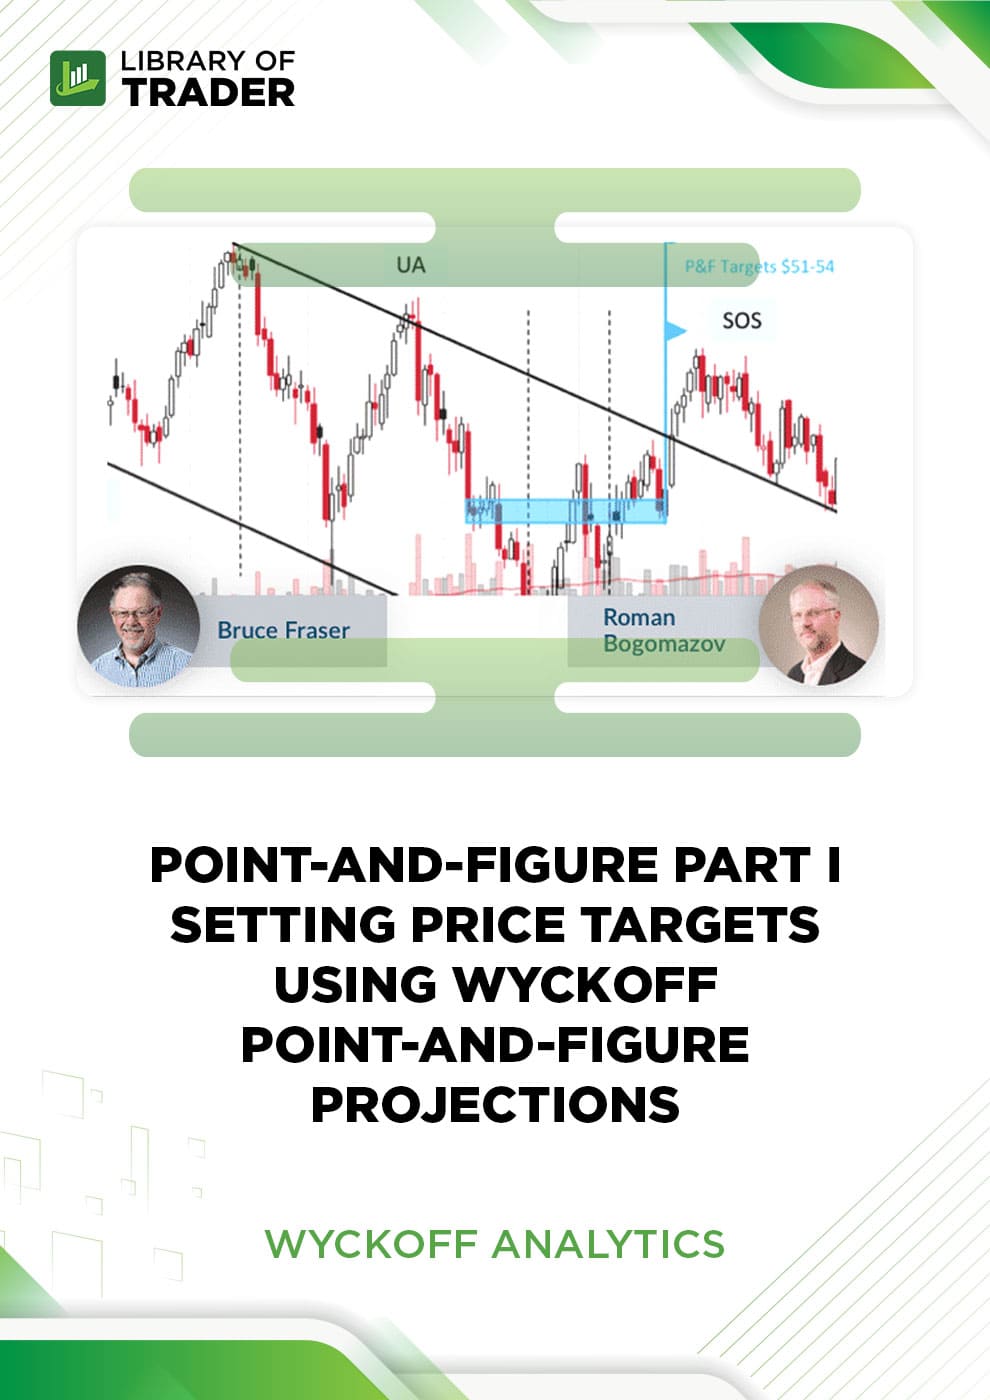
Point-and-Figure Part I Setting Price Targets Using Wyckoff Point-and-Figure Projections of Wyckoff Analytics, Bruce Fraser and Roman Bogomazov cover the fundamentals of using Point-and-Figure charts to calculate price targets using Wyckoff’s specific horizontal counting method.
The trading path Point-and-Figure Part I Setting Price Targets Using Wyckoff Point-and-Figure Projections present the substances as case studies that begin with a blank P&F chart and then, as the chart unfolds over time, they display to you their step-by-step method for taking and projecting horizontal counts.
Course Outline
How to assemble a Wyckoff-style Point-and-Figure chart
Basic Wyckoff P&F count guidelines and current applications
P&F Phase Analysis to expect shorter- and longer-term price objectives for both long and short trades
What will you learn?
The best approaches to choosing potential stocks and the most advantageous times to buy them
The way to create and use Wyckoff-based point and figure charts to measure real price target
Who is the course for?
Those who want to explore the basic knowledge of using Point and Figure charts
The methods are applied in swing trading and day trading
Additional Information
Point-and-Figure includes 3 parts, and you can follow all of them to optimize your skills in Swing and Day Trading:
Point-and-Figure Part I: Setting Price Targets Using Wyckoff Point-and-Figure Projections
Point and Figure Part II: Projecting P&F Price Targets Across Multiple Time Frames
Point-And-Figure Part III: Developing a systematic approach to trading using Wyckoff Point-and-Figure Charts